Know before the results are in
Calculates outcomes that haven't happened yet, like demand, defects, quality, and failures, from today's data.

ECHO Analyze
ECHO Analyze is Wavegram's machine learning platform. Build and validate AI models on production, equipment, quality, and sales data to predict demand, defects, and failures in advance and find optimal conditions for your goals. MES, dashboards, and the Orchestrator call the models directly.
Calculates outcomes that haven't happened yet, like demand, defects, quality, and failures, from today's data.
Enter the outcome you want and the adjustable range, and it returns the closest candidate conditions and expected results.
Validated models deploy via API, so MES, dashboards, and the Orchestrator share the same model.
Even in operation, it compares predictions with actuals, alerts you when performance drops, and swaps in a retrained model.
Define prediction targets and training data, and compare evaluation results by model to choose which to apply.
Examine how production conditions relate to inspection values, using predictions as input for process checks and quality decisions.
Compares equipment values' usual patterns with change periods, using the analysis to set inspection targets and maintenance order.
Merges scattered equipment · production · quality data by time and key, and shows missing and wrong values first as a quality score.
Train multiple machine learning models on the same data, compare them against the same acceptance criteria (R² · error, etc.), and pick the best fit.
Build the right model for the problem on one screen: numeric prediction, pass · fail classification, anomaly detection, and time-series forecasting.
Enter a target outcome, and the model runs in reverse to calculate candidate conditions and the expected result for each. Try changes in the simulator first.
Deploy a validated model with one click. Business systems and AI agents call predictions with a single API line.
Keeps model versions, training data, and evaluation results as history, and monitors performance in operation to flag when to retrain.
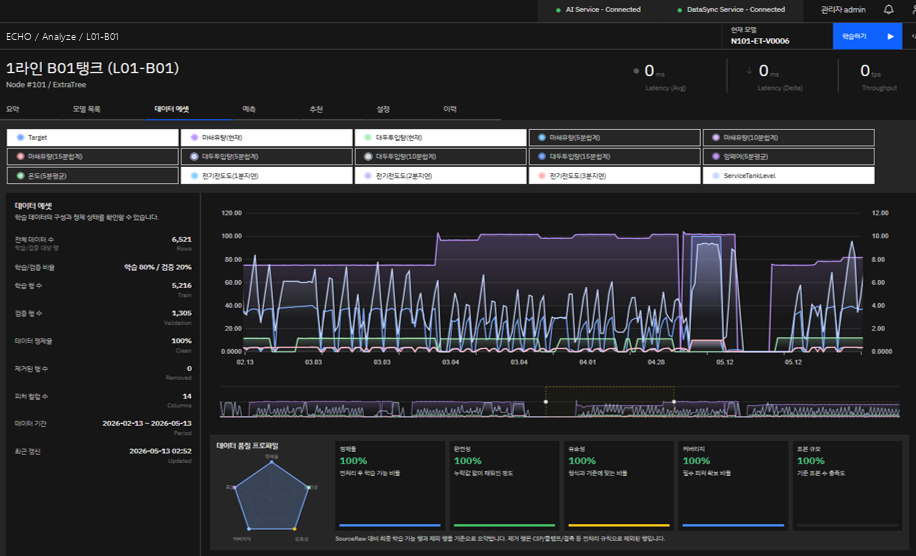
Screen 1 · record count, train · validation split, trend by sensor, data quality profile
A real deployment screen. Graphs and quality scores first show how many training records there are and whether any values are missing or wrong.
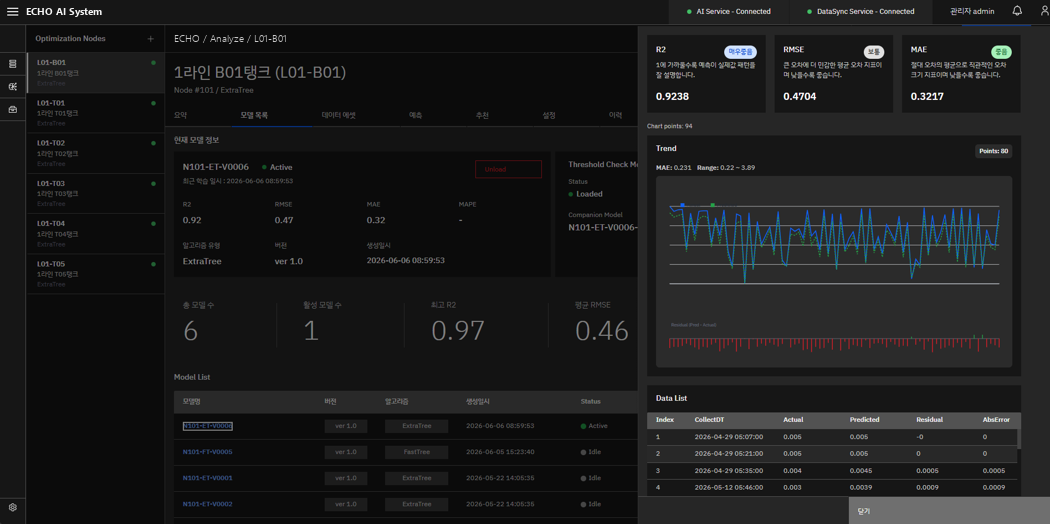
Screen 2 · current model, accuracy metrics, model list, actual · predicted trend
A real deployment screen. Trained models are placed side by side, and the best fit is chosen by metrics and actual vs. predicted trends.
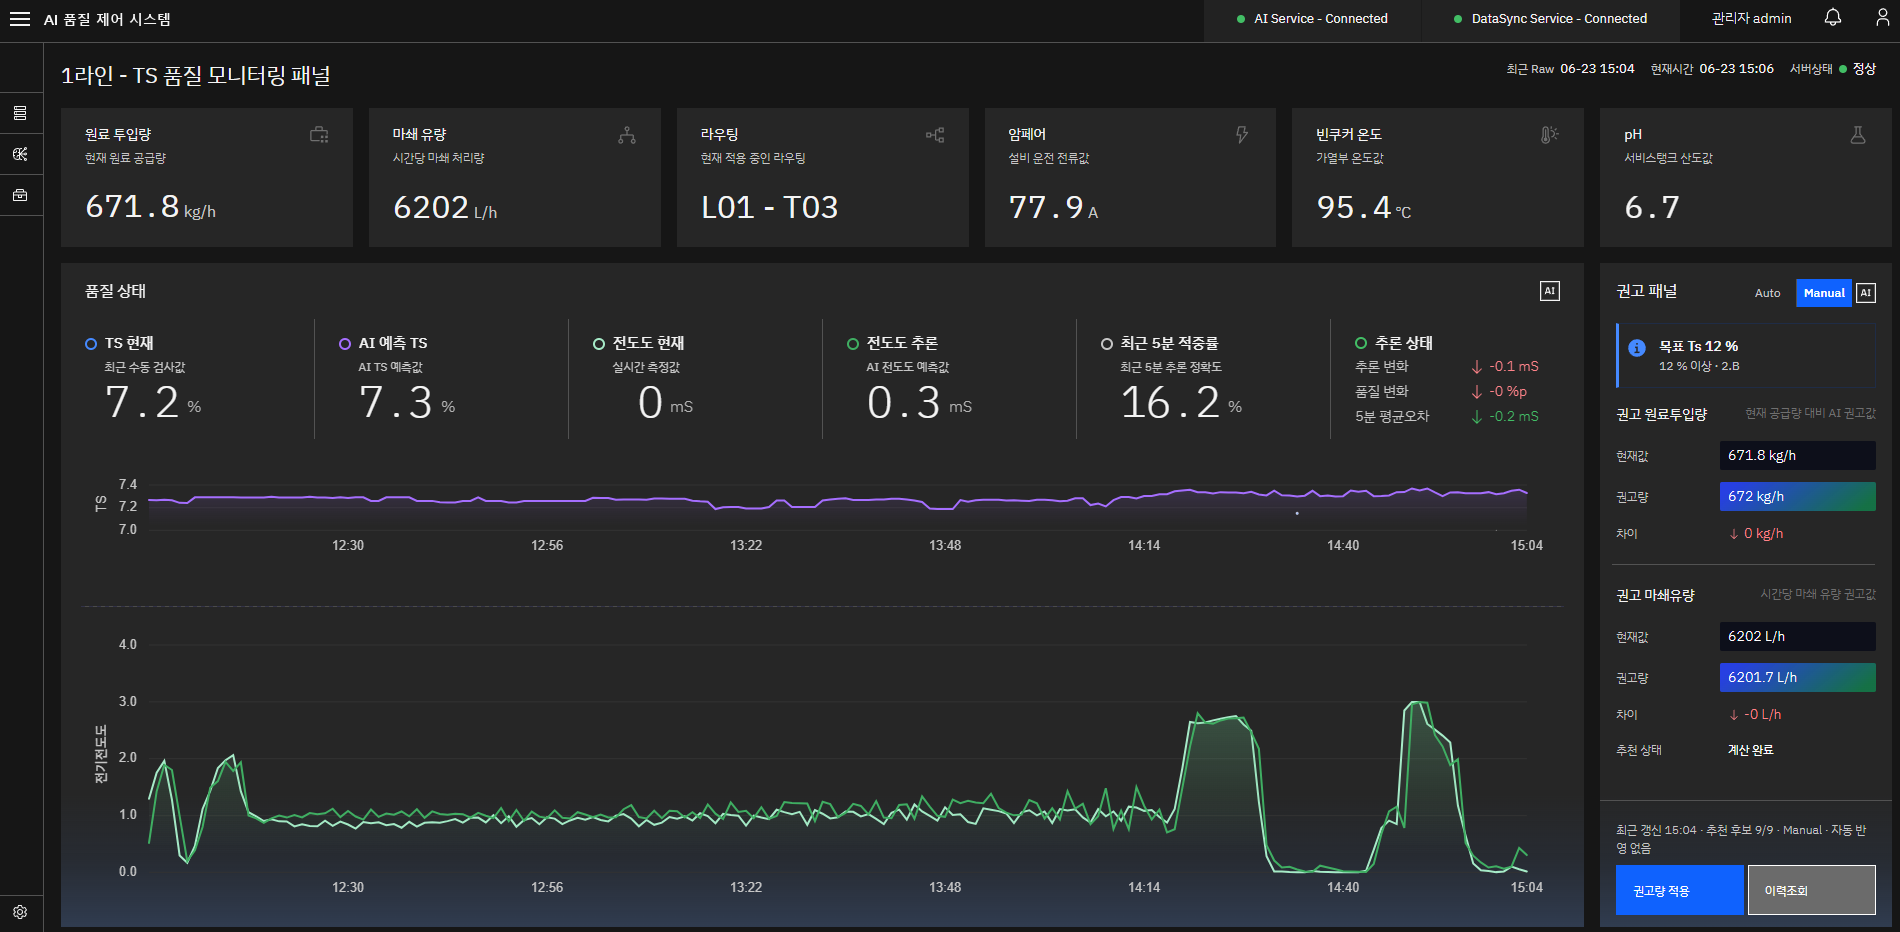
Screen 3 · current process values, measured quality, AI-predicted quality, recommendation panel
A real deployment screen. It predicts quality in real time during operation and calculates recommended raw-material feed and flow when quality drifts from target. Autopilot mode applies recommendations immediately; Manual mode applies them after the owner confirms.
Predicts quality from in-process values without waiting for final inspection, alerting you before it goes out of spec.
Recommends the next batch's feed and operating conditions to hit target quality, even as raw material varies.
Forecasts demand by item from past sales and order data to set production plans and inventory levels.
Learns normal operating patterns, scores unusual behavior, and catches failure signs early.
Replays past production data to calculate results under new conditions, reducing tests that once required real batches.
Predicts material properties and lifespan from test data and recommends material combinations for the operating conditions.
Add products one at a time as needed, and expand like this.
Deployment model
Configuration and cost vary with scope, user count, and installation environment. Tell us your situation and we will recommend the right approach.
Contact salesDesign where training and calls run to fit data export rules: on-premises, cloud, or internal network.
Uses MES production records and LINKER equipment values as training and evaluation data.
Delivers predictions to business apps and AI through a model call interface.
All you need is the outcome you want to predict stored alongside the values that affect it. MES · ERP records, equipment values collected by LINKER, and even Excel data work as is.
Yes. Data prep, model comparison, evaluation, and deployment are linked on screen, so business users just review results and choose. Wavegram builds the models with you in the early stages.
It starts with recommendations, then applies them automatically in stages, beginning with ranges that pass the simulator and live validation.
Generative AI writes text and answers; Analyze predicts numbers and calculates optimal conditions from your company's data. Both work together in the ECHO Orchestrator.
Acceptance criteria (R², etc.) are set for each model in advance, and only models validated by replaying past data and live comparison are used.
No. Wavegram has specialized in AI vision and AI products since 2020. Because everything is built on our own technology, we can optimize for any customer's unique processes.