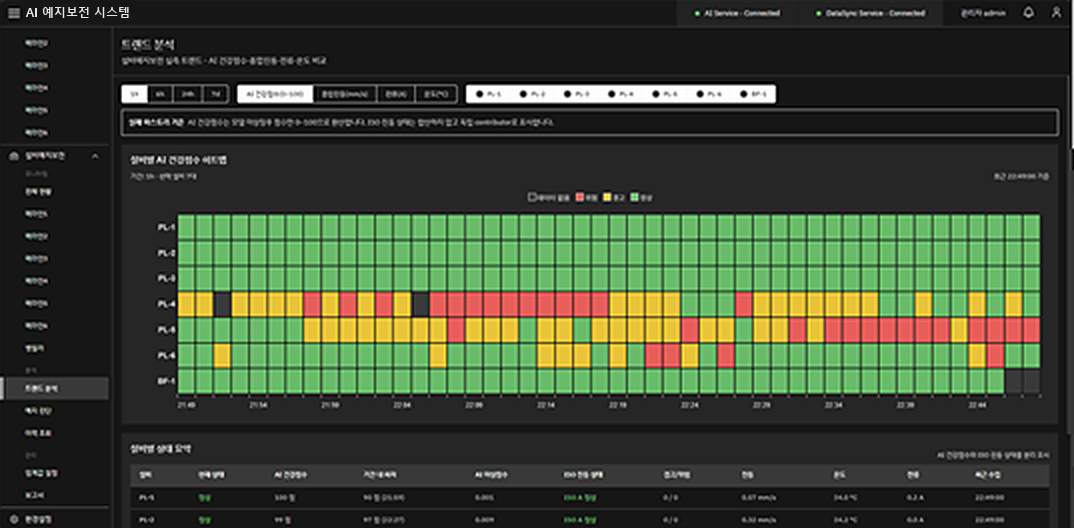
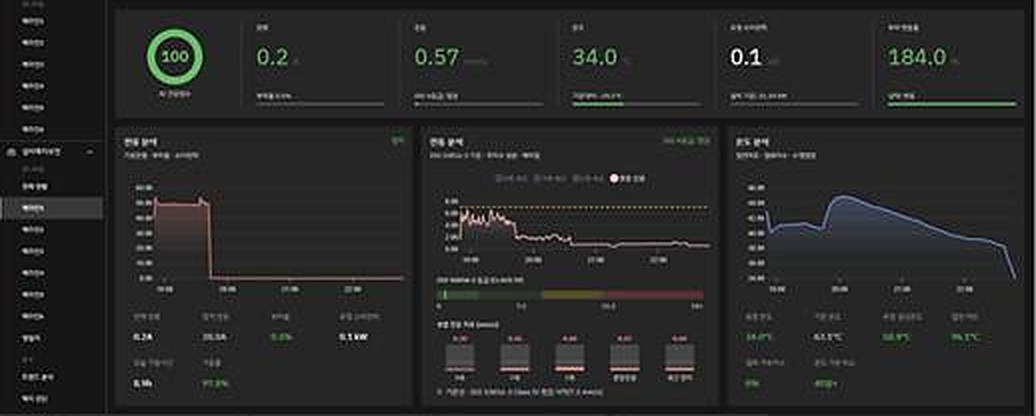
ECHO Predict

ECHO Predict watches equipment health every minute, every second. It finds unusual behavior in vibration, current, and temperature and alerts you before failure. Obvious risks are caught by thresholds; subtle signs are caught by AI trained on your own equipment data.

Live vibration · current · temperature
Every second
Thresholds + AI patterns
Two-layer monitoring
Two-level early alerts
Warning · danger
Trained on normal operating data
Without failure records
Key benefits

Stop sudden breakdowns at the first sign

Catches units that used to stop without warning at the early-sign stage, reducing unplanned downtime.

Turn maintenance into a schedule

Schedule maintenance on early signs, not repairs after failure.

See risks and early signs separately

Thresholds catch obvious risks; AI catches subtle signs.

Tune thresholds on the floor

Operated while correcting false positives and misses with floor feedback.

Who uses it

Viewed together by maintenance, production, and plant leaders

Equipment · maintenance staff

Review sensor trends and anomaly severity for alerted units to decide whether and when to inspect.

Production managers

Maintenance is built into the production plan in advance, reducing unplanned downtime.

Plant manager · quality lead

Review equipment condition and quality history together to time equipment investment and replacement.

Functions

Collect, learn, alert

01

Connect your sensors

Collects vibration · current · temperature sensor and PLC values in real time with LINKER SERVER.

02

Teach it what normal looks like first

No failure records needed. Pick normal operating periods and AI learns what normal looks like.

03

Catch risks instantly with thresholds

Normal ranges are set per sensor, with an immediate danger alert when exceeded.

04

AI catches the subtle signs

AI scores small drifts from the usual pattern and alerts you before failure.

05

Separate warnings from danger alerts

Alerts owners with signs as warnings and obvious risks as danger.

06

Tune thresholds on the floor

Accuracy improves as false alerts and missed signs are corrected with floor feedback.

Screens

See equipment status on screen

Screen 1 · health score by unit, vibration · current · temperature, failure risk causes, inspection advice

AI health score by unit

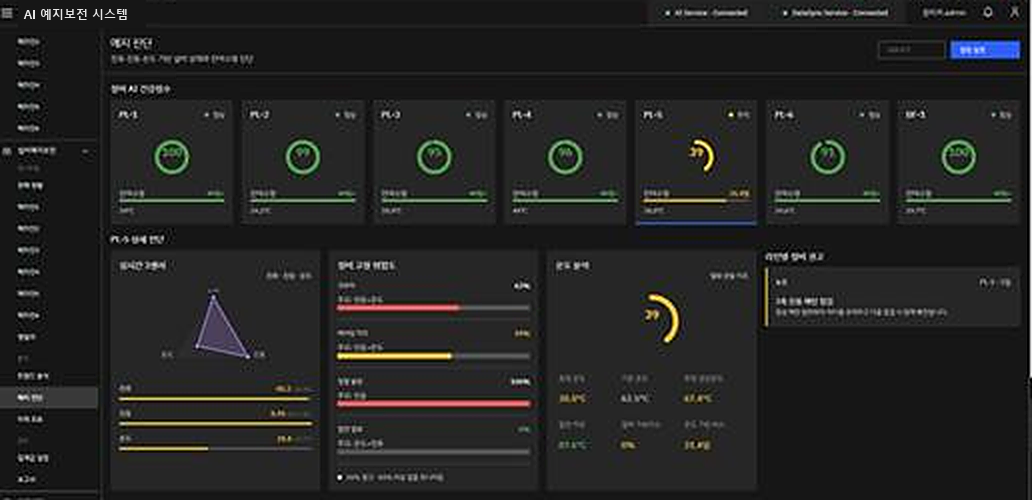
A real deployment screen. It shows an AI health score for each unit, and units with falling scores lead straight to sensor graphs, failure risk causes, and inspection recommendations.
  • Health score
  • Risk causes
  • Inspection advice
ECHO Predict · predictive diagnosis
A real AI predictive maintenance screen: AI health scores for 7 units, vibration · current · temperature graphs for units on watch, failure risk causes, temperature analysis, and inspection recommendations
Use cases

Apply it first to equipment that stops often

Rotating equipment

Catches bearing and shaft anomalies from vibration and current changes in grinders, pumps, and motors.

Heating equipment

Finds periods when the heater temperature trend departs from its usual pattern.

Centrifuge equipment

Patterns where speed and load fluctuate together are treated as anomaly signs.

Automated lines

Combines run · stop records and sensor values from line equipment to predict failure signs.

Case studies

Already watching in front of the equipment

Food manufacturing · beverages

Alerts you before equipment stops

Projects
When key equipment stopped without warning, production plans and quality collapsed together. Maintenance began only after a failure.
Method
Vibration, current, and temperature sensors are connected and monitored in two layers. Upper and lower limits per sensor, set from normal-operation data, catch obvious risks instantly, while AI learns normal patterns to catch signs that drift slowly over time. Warning and danger thresholds are separated, and false positives and misses are tuned on site.
What changed
Shift from repair-after-failure to maintenance planned on early signs. Dashboards and alerts put maintenance staff a step ahead.
Analyze · LINKER · LinkerFlow
Secondary battery materials

Text alerts first for environmental equipment faults; causes in the data

Projects
Environmental equipment like bag filters, scrubbers, and dust collectors was scattered across the plant, so stops or faults went unnoticed until the next patrol. Why a unit stopped was never recorded.
Method
Linker Server collects front and rear temperature, level, blower current, circulation temperature, and cumulative energy from every unit in real time. Three-level conditions (warning · caution · watch) are set per unit, triggering SMS to the owner when met, while run and idle time and alarm history build up to analyze failure causes and stop patterns.
What changed
When something goes wrong, the owner's phone rings first. Uptime and stop history per unit build up weekly, so units with recurring failures are found and fixed first.
Linker Server · LinkerFlow
Manufacturing equipment

Predicts failure signs from monitoring data

Projects
Equipment monitoring screens showed only current status, with no way to know when a failure would come.
Method
Built a structure that uses equipment data collected by Linker Server directly as training data, and added a failure-sign prediction model.
What changed
The collection server becomes your AI training data warehouse. Start predicting with no separate data migration.
LINKER · Analyze
Use-case scenarios

Link LINKER and MES, and maintenance becomes part of the production plan

Add products one at a time as needed, and expand like this.

LINKER + Predict + LinkerFlow
  1. LINKER Collect sensor values.
  2. Predict Calculates an anomaly score.
  3. LinkerFlow Show warnings on the dashboard.
Predict + Orchestrator + TEAMS
  1. Predict A warning is raised.
  2. Orchestrator Organizes maintenance history and inspection items.
  3. TEAMS Sends a message to the maintenance owner.
Predict + MES
  1. Predict Schedules maintenance.
  2. MES Builds maintenance time into the production plan.
  3. Adjusts work orders.
Alongside existing systems

Sensor values never leave the plant

Deployment model

Configuration and cost vary with scope, user count, and installation environment. Tell us your situation and we will recommend the right approach.

Contact sales

Installation environment

Installed on servers inside the plant, so equipment data never leaves.

Existing system integration

Existing PLCs and sensors feed in as is through LINKER, and alerts go out via messenger and dashboards.

Open standards

Uses OPC UA, Modbus, MQTT sensor and PLC data.

FAQ

FAQ

Does it work with almost no failure data?

Yes. It learns from normal operating data, not failure data, and measures how far behavior departs from normal.

Do I need to install new sensors?

Start with existing PLC values and sensors. If a critical value like vibration is missing, we design the added sensors with you.

What if there are too many false alarms?

Separate warning and danger thresholds, and refine them with floor feedback to reduce false alarms.

How long does deployment take?

It proceeds through data analysis, defining normal ranges, model building, pilot operation, and rollout, varying with equipment count and data condition.