Your own screens, without developers
Just drag and drop widgets to build a monitoring screen. When the line changes, on-site staff edit it themselves.

LinkerFlow
A web dashboard that shows equipment, production, and quality data in real time. Just drag and drop from dozens of widgets to build monitoring screens for your site without development, and open them in a browser on anything from floor monitors to tablets.
Just drag and drop widgets to build a monitoring screen. When the line changes, on-site staff edit it themselves.
Out-of-spec values stand out with color and markers. A glance at the monitor in passing is enough.
With just a browser, view the same screen at once on floor monitors, office PCs, tablets, and phones.
No matter how much data, a full year of records loads in under 1 second. Overlay tens of thousands of tags for comparative analysis.
See output and goal attainment by line on one screen. Find lines falling short and direct the floor right away.
Compare equipment uptime, inspection results, and temperature · humidity against baselines. When an anomaly flag appears, find the cause period in the detail chart.
Link LINKER tags and MES items to widgets, then deploy dashboards to floor monitors and office PCs.
Values, gauges, progress, composition, trends, donuts, and delta comparisons. Each widget has a minimum size, so the screen never breaks no matter how you arrange it.
Drag and resize widgets and your monitoring screen is done. No need to outsource development just to change one screen.
Build and switch between dashboards per line, per unit, and for the office. Use a plant layout or building drawing as the background.
Set a baseline on a widget and out-of-range values stand out with color and markers. Actions can be set for each event.
No matter how much data, a full year of records loads in under 1 second. Page through dates in the detail chart and check values for a selected range in a table.
Pick what you need from tens of thousands of tags, overlay them on one chart to compare, and export the results straight to Excel for reports.
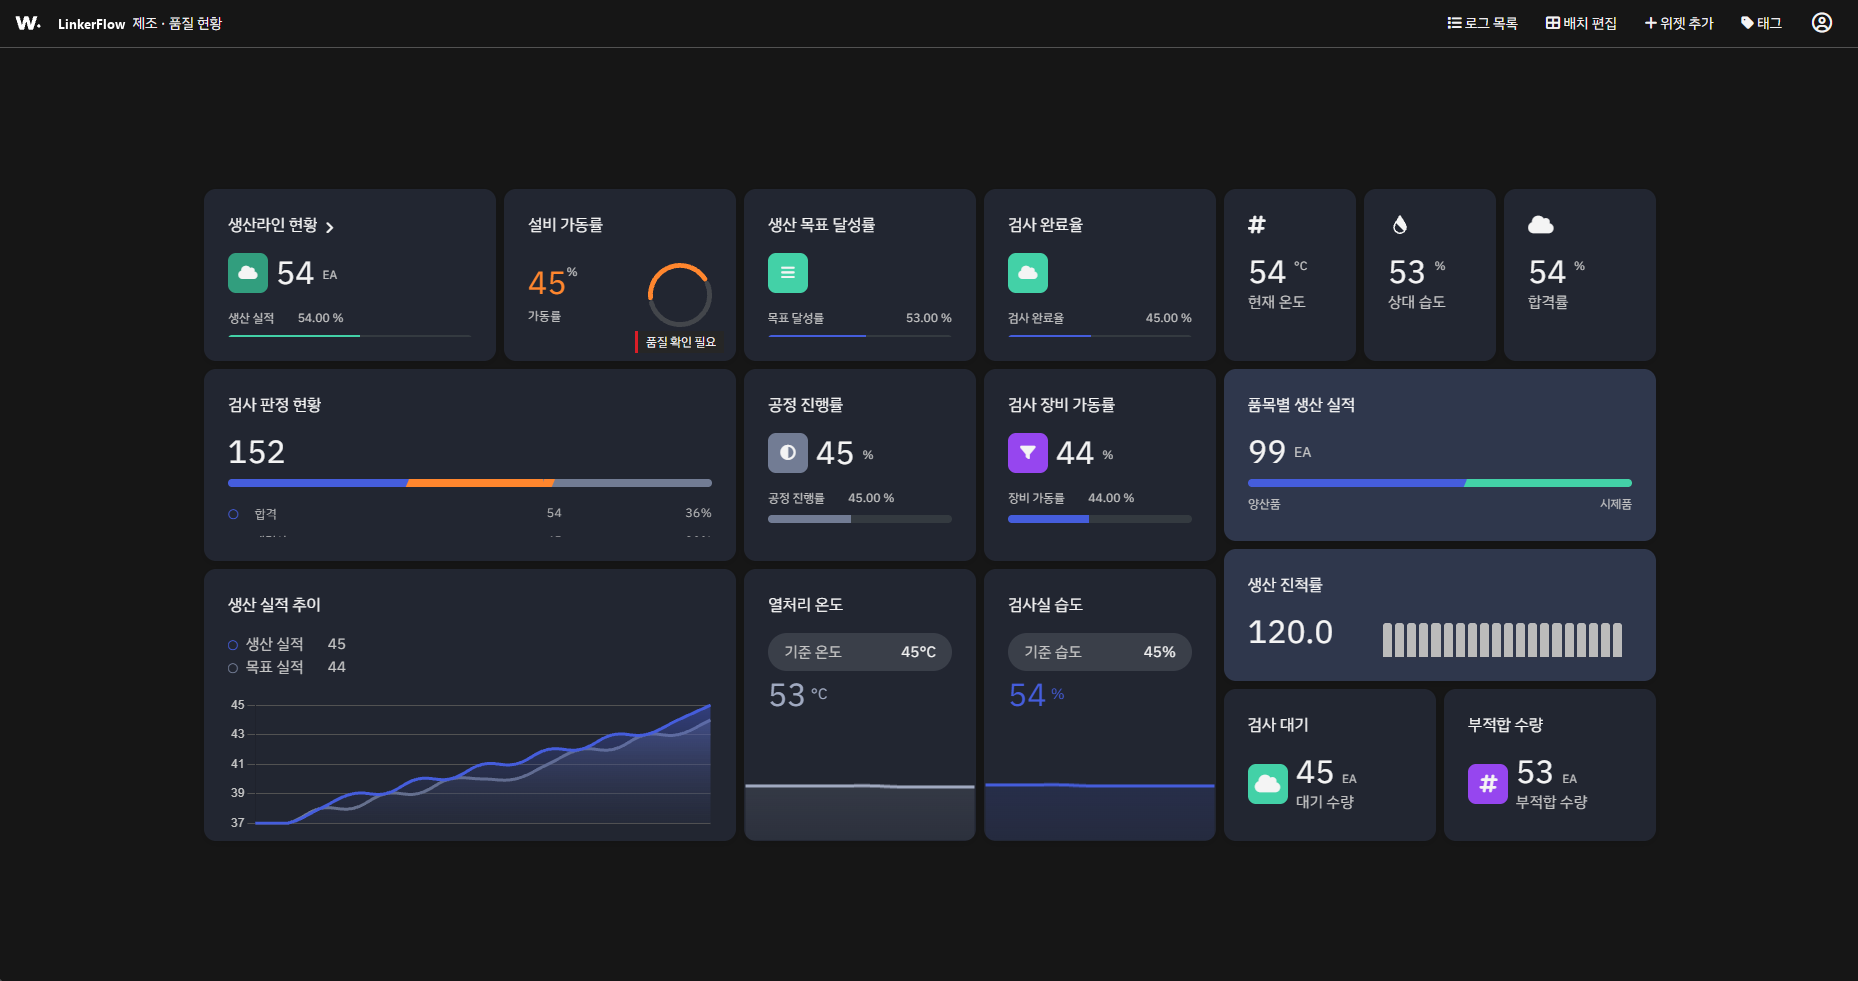
Screen 1 · line status, equipment uptime, goal attainment, inspection completion, temperature · humidity, output trend
Production, equipment, and quality for one line on one screen. Out-of-spec items like 'Quality check needed' show up right below uptime.
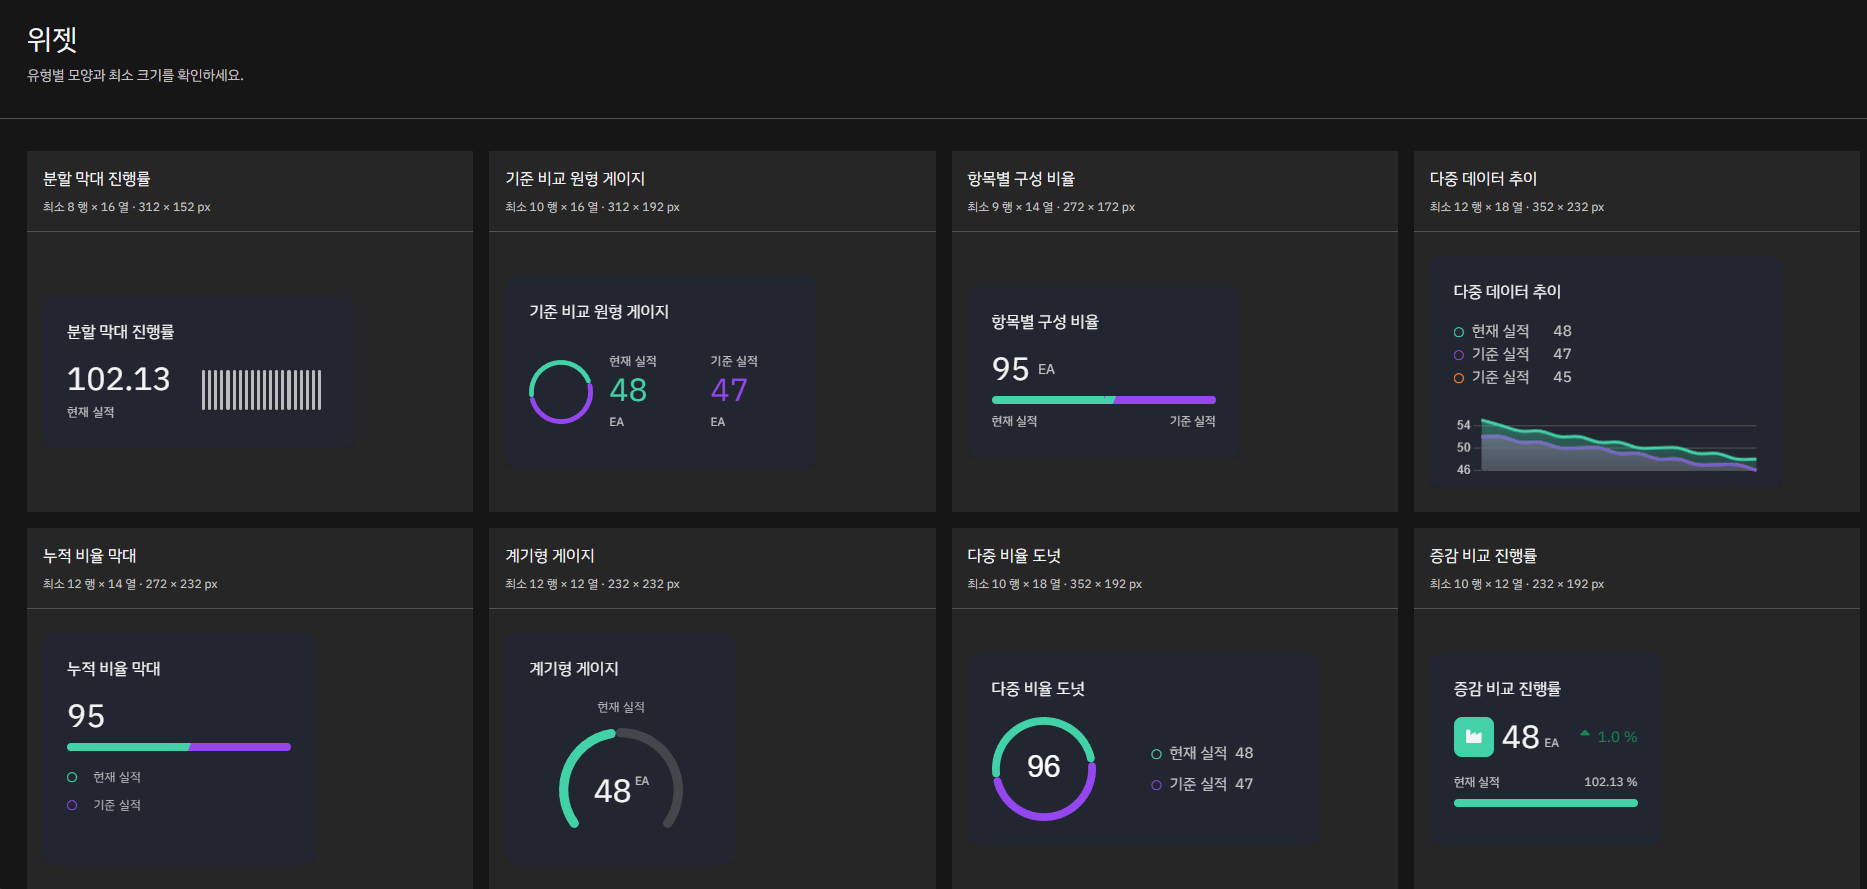
Screen 2 · segmented bar, circular gauge, composition, multi-trend, stacked bar, dial gauge, multi-donut, delta comparison
Each widget has a defined shape and minimum size, built with large numbers and colors that read from across the floor.
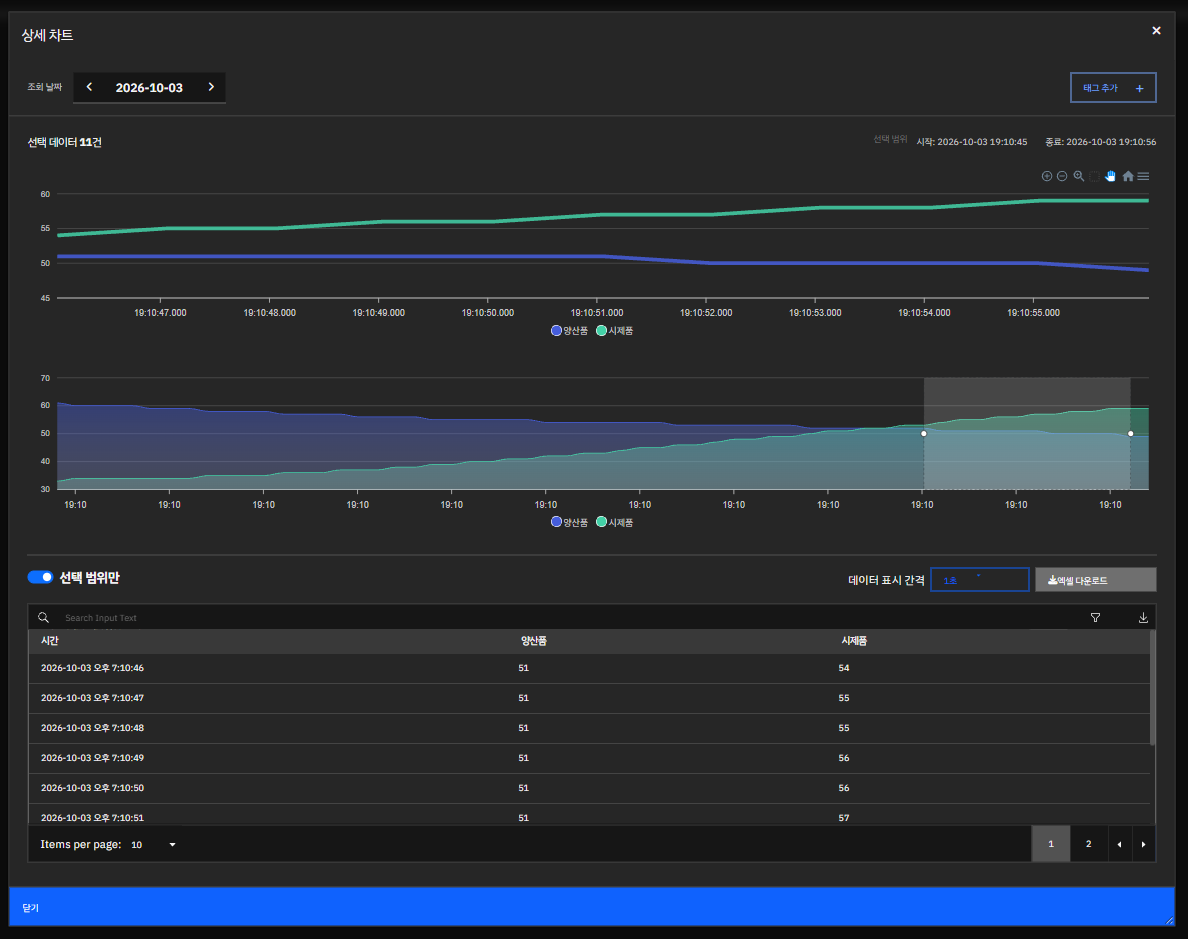
Screen 3 · date navigation, overlay two items, range selection on overall trend, data display interval, selected range values, Excel download
Open a widget to see that day's trend. Drag to select a range in the overall trend, see only that range's values in a table, and export straight to Excel.
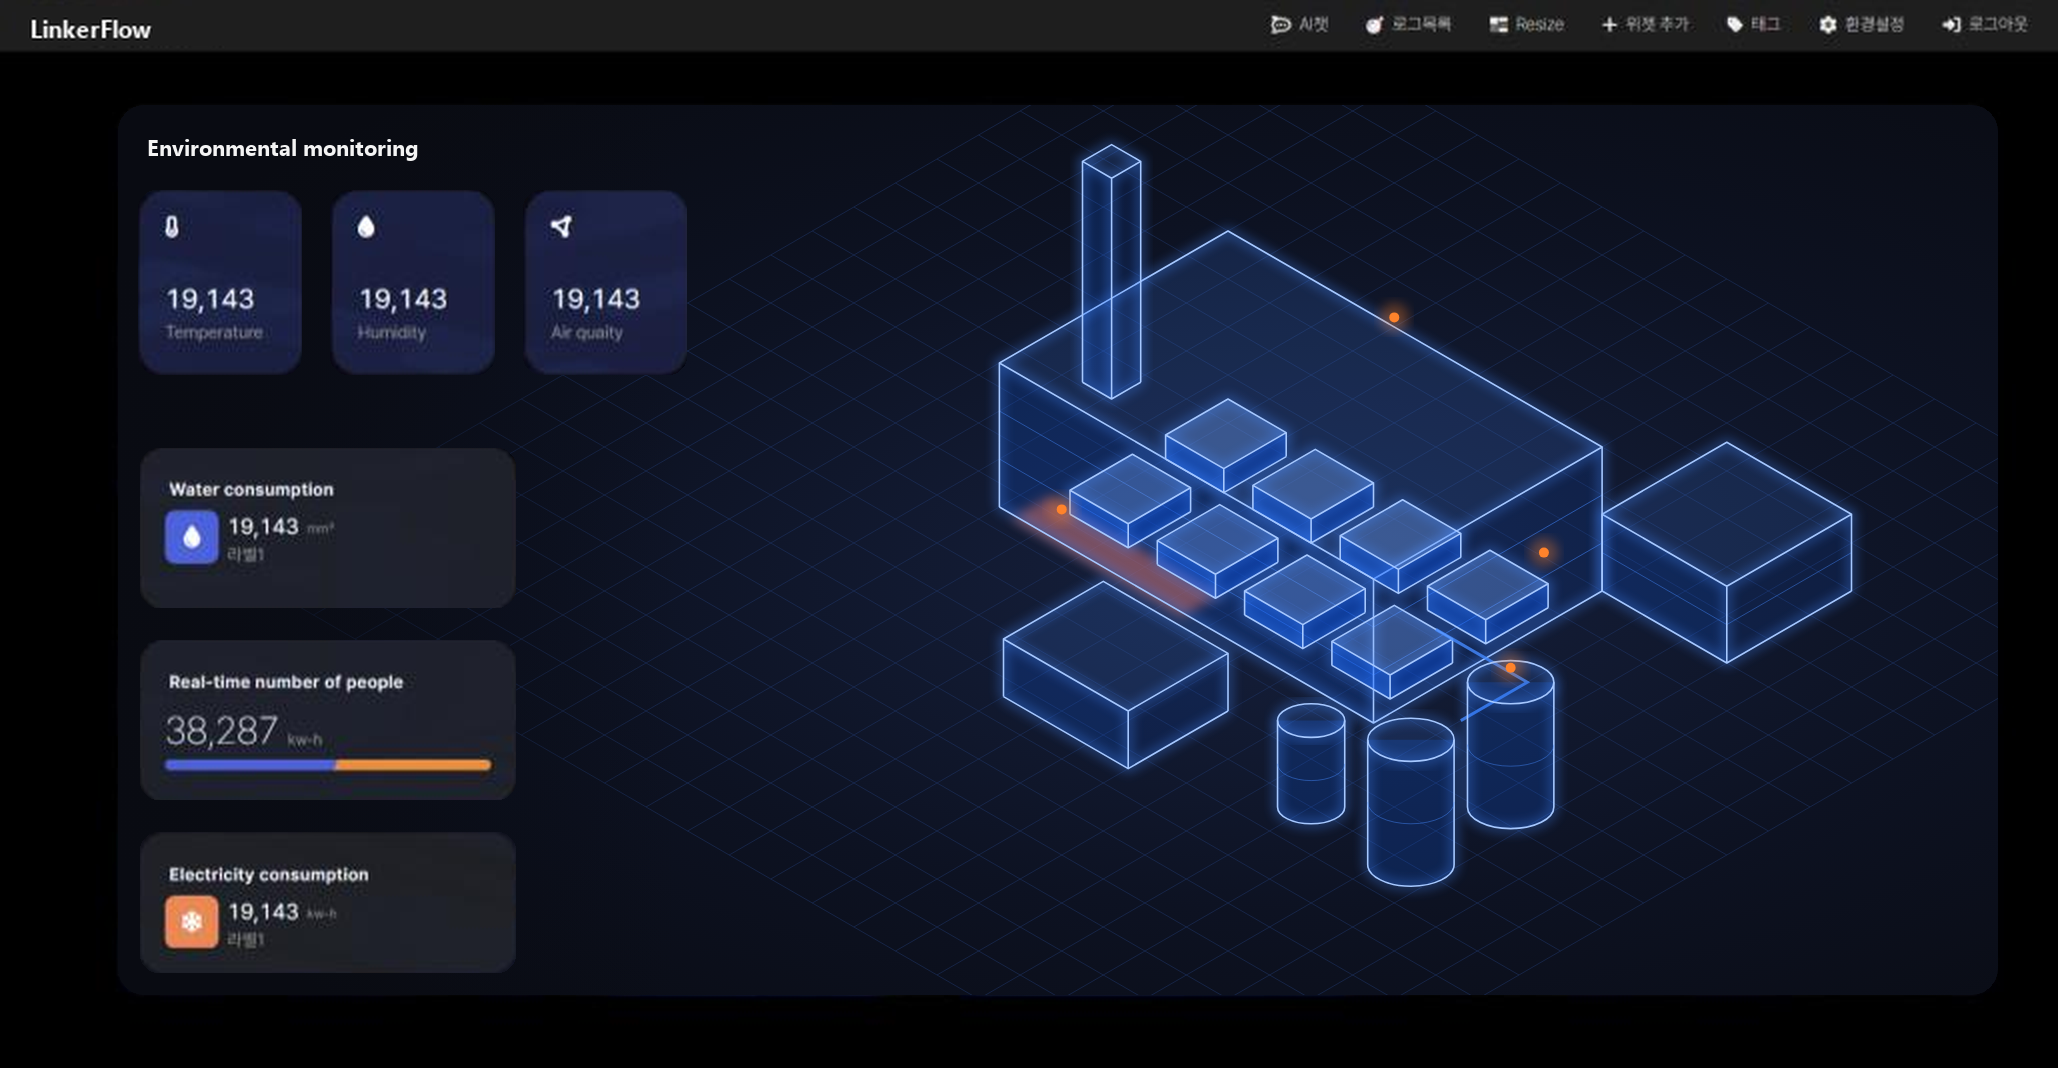
Screen 4 · plant layout background, temperature, humidity, air quality, water usage, live headcount, power usage
Place widgets over a background image to show the plant and equipment visually. Plant layouts and equipment photos work as backgrounds too.
The production manager puts output and goal attainment on the monitor at the line entrance, so operators see today's progress as they pass.
The equipment owner views uptime and heat-treatment temperature against baselines. When uptime drops, the detail chart pinpoints when it stopped.
Quality staff compare lab temperature · humidity with standards and recheck results inspected during out-of-spec hours.
The plant manager sees attainment, defects, and pending inspections across lines on one screen, and clicks a line to drill into details.
Add products one at a time as needed, and expand like this.
Deployment model
Configuration and cost vary with scope, user count, and installation environment. Tell us your situation and we will recommend the right approach.
Contact salesInstall it on a company server for use inside the plant network, or run it in the cloud to oversee multiple sites. All you need is a browser.
It uses equipment values collected by LINKER and WaveWorks MES output as is. Values from other MES or DBs are received and shown via LINKER Client.
LINKER handles OPC · PLC · HSMS/SECS communication, and LinkerFlow is a web-standard screen that opens on floor monitors, tablets, and PCs alike.
Equipment values come in through LINKER. To show only business system values like MES output, connect with LINKER Client.
On-site staff build it by dragging and dropping widgets. No developer needed to change a screen or add another dashboard.
Yes. Open the same dashboard at once on floor monitors, office PCs, tablets, and phones. No program to install.
Opens on any monitor, tablet, or PC with a web browser. Dark backgrounds and large numbers read from a distance.
Yes. No matter how much data, a full year of records loads in under 1 second. Open a widget to page through dates in a detail chart. View values for a selected range as a table and export to Excel. Check alert history in the log list.